rotation_example.py
As an exmaple of basic functionality, let’s plot a plane, the pole to the plane, and a rake along the plane.
import matplotlib.pyplot as plt
import mplstereonet
fig = plt.figure()
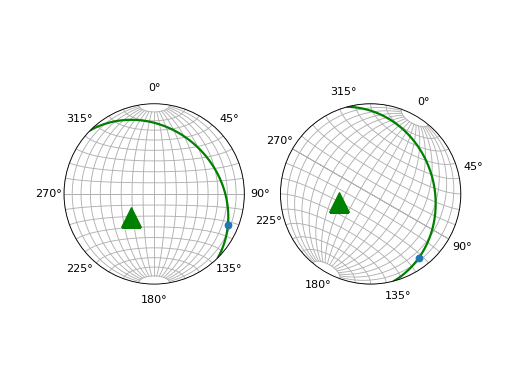
# An un-rotated axes
ax1 = fig.add_subplot(121, projection='stereonet')
# Rotated 30 degrees clockwise from North
ax2 = fig.add_subplot(122, projection='stereonet', rotation=30)
# Measurements follow the right-hand-rule to indicate dip direction
strike, dip = 315, 30
# Plot the same data on both axes
for ax in [ax1, ax2]:
ax.plane(strike, dip, 'g-', linewidth=2)
ax.pole(strike, dip, 'g^', markersize=18)
ax.rake(strike, dip, -25)
ax.grid()
plt.show()
Result