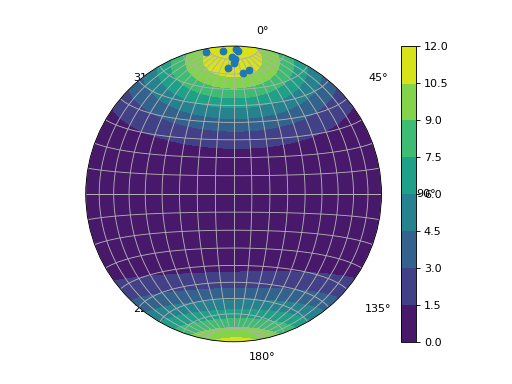
contouring.py
A basic example of producing a density contour plot of poles to planes.
import matplotlib.pyplot as plt
import numpy as np
import mplstereonet

# Fix random seed so that output is consistent
np.random.seed(1977)

fig, ax = mplstereonet.subplots()

# Generate a random scatter of planes around the given plane
# All measurements follow the right-hand-rule to indicate dip direction
strike, dip = 90, 80
num = 10
strikes = strike + 10 * np.random.randn(num)
dips = dip + 10 * np.random.randn(num)

# Create filled contours of the poles of the generated planes...
# By default this uses a modified Kamb contouring technique with exponential
# smoothing (See Vollmer, 1995)
cax = ax.density_contourf(strikes, dips, measurement='poles')

# Plot the poles as points on top of the contours
ax.pole(strikes, dips)

# Turn on a grid and add a colorbar
ax.grid(True)
fig.colorbar(cax)
plt.show()
Result