scatter.py
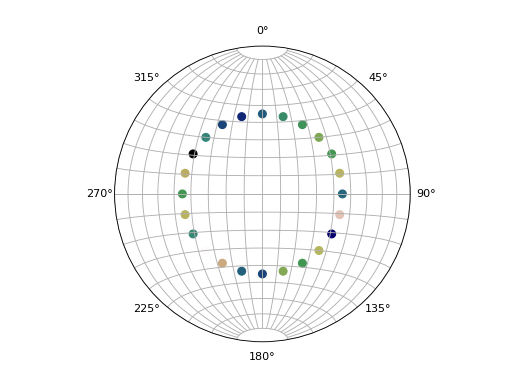
Example of how ax.scatter can be used to plot linear data on a stereonet varying color and/or size by other variables.
This also serves as a general example of how to convert orientation data into the coordinate system that the stereonet plot uses so that generic matplotlib plotting methods may be used.
import numpy as np
import matplotlib.pyplot as plt
import mplstereonet
np.random.seed(1)

strikes = np.arange(0, 360, 15)
dips = 45 * np.ones(strikes.size)
magnitude = np.random.random(strikes.size)

# Convert our strikes and dips to stereonet coordinates
lons, lats = mplstereonet.pole(strikes, dips)

# Now we'll plot our data and color by magnitude
fig, ax = mplstereonet.subplots()
sm = ax.scatter(lons, lats, c=magnitude, s=50, cmap='gist_earth')

ax.grid()
plt.show()
Result