polar_overlay.py
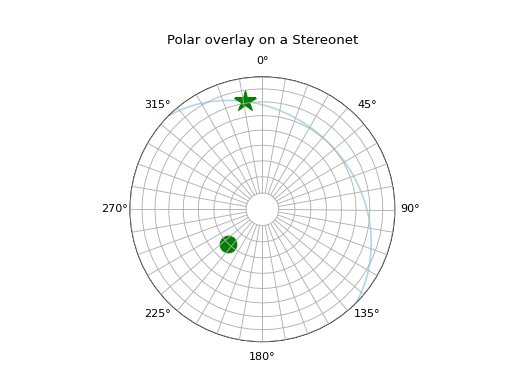
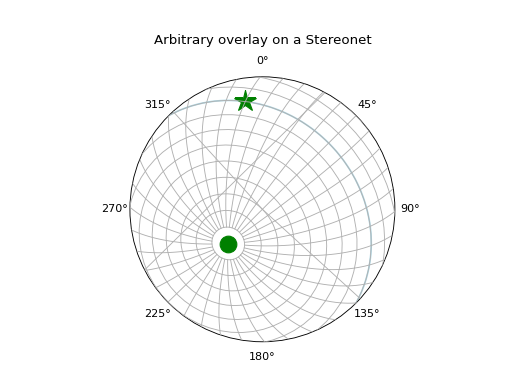
Demonstrates adding both polar and arbitrary grid overlays on a stereonet. Changing the grid overlay does not change the representation of the data. Notice that the plane, pole, and rake are all displayed identically in each case. Only the grid lines change.
import matplotlib.pyplot as plt
import mplstereonet

def main():
    # Display the data with a polar grid
    ax1 = basic()
    ax1.grid(kind='polar')
    ax1.set_title('Polar overlay on a Stereonet', y=1.1)

    # Display the data with a grid centered on the pole to the plotted plane.
    ax2 = basic()
    ax2.grid(center=mplstereonet.pole(315, 30))
    ax2.set_title('Arbitrary overlay on a Stereonet', y=1.1)

    plt.show()

def basic():
    """Set up a basic stereonet and plot the same data each time."""
    fig, ax = mplstereonet.subplots()

    strike, dip = 315, 30
    ax.plane(strike, dip, color='lightblue')
    ax.pole(strike, dip, color='green', markersize=15)
    ax.rake(strike, dip, 40, marker='*', markersize=20, color='green')

    # Make a bit of room for the title...
    fig.subplots_adjust(top=0.8)

    return ax

if __name__ == '__main__':
    main()