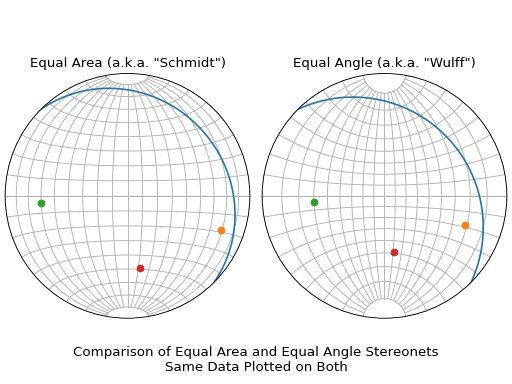
equal_area_equal_angle_comparison.py
A quick visual comparison of equal area vs. equal angle nets.
import matplotlib.pyplot as plt
import mplstereonet

fig = plt.figure()

# Make an "equal area" (a.k.a. "Schmidt") stereonet
# (Lambert Azimuthal Equal Area Projection)
ax1 = fig.add_subplot(1,2,1, projection='equal_area_stereonet')

# Make an "equal angle" (a.k.a. "Wulff" or "True") stereonet
# (Stereographic projection)
ax2 = fig.add_subplot(1,2,2, projection='equal_angle_stereonet')

# Plot the same thing on both
for ax in [ax1, ax2]:
    ax.grid(True)
    ax.set_azimuth_ticklabels([])
    ax.plane(315, 20)
    ax.line([20, 30, 40], [110, 265, 170])

ax1.set_title('Equal Area (a.k.a. "Schmidt")')
ax2.set_title('Equal Angle (a.k.a. "Wulff")')

# Make the subplots fit a bit more compactly (purely cosmetic)
fig.subplots_adjust(hspace=0, wspace=0.05, left=0.01, bottom=0.1, right=0.99)

fig.suptitle('Comparison of Equal Area and Equal Angle Stereonets\n'
             'Same Data Plotted on Both', y=0.1)
plt.show()
Result