fault_slip_plot.py
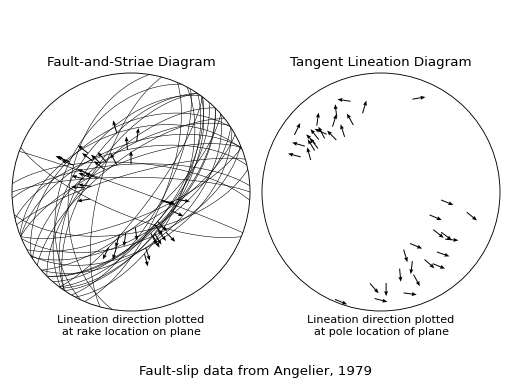
Illustrates two different methods of plotting fault slip data.
A fault-and-striae diagram is the traditional method. The tangent-lineation diagram follows Twiss & Unruh, 1988 (this style was originally introduced by Goldstein & Marshak, 1988 and also by Hoeppener, 1955, but both used the opposite convention for arrow direction).
import matplotlib.pyplot as plt
import numpy as np
import mplstereonet

import parse_angelier_data

def main():
    # Load data from Angelier, 1979
    strikes, dips, rakes = parse_angelier_data.load()

    params = dict(projection='stereonet', azimuth_ticks=[])
    fig, (ax1, ax2) = plt.subplots(ncols=2, subplot_kw=params)

    fault_and_striae_plot(ax1, strikes, dips, rakes)
    ax1.set_title('Fault-and-Striae Diagram')
    ax1.set_xlabel('Lineation direction plotted\nat rake location on plane')

    tangent_lineation_plot(ax2, strikes, dips, rakes)
    ax2.set_title('Tangent Lineation Diagram')
    ax2.set_xlabel('Lineation direction plotted\nat pole location of plane')

    fig.suptitle('Fault-slip data from Angelier, 1979', y=0.05)
    fig.tight_layout()

    plt.show()

def fault_and_striae_plot(ax, strikes, dips, rakes):
    """Makes a fault-and-striae plot (a.k.a. "Ball of String") for normal faults
    with the given strikes, dips, and rakes."""
    # Plot the planes
    lines = ax.plane(strikes, dips, 'k-', lw=0.5)

    # Calculate the position of the rake of the lineations, but don't plot yet
    x, y = mplstereonet.rake(strikes, dips, rakes)

    # Calculate the direction the arrows should point
    # These are all normal faults, so the arrows point away from the center
    # For thrusts, it would just be u, v = -x/mag, -y/mag
    mag = np.hypot(x, y)
    u, v = x / mag, y / mag

    # Plot the arrows at the rake locations...
    arrows = ax.quiver(x, y, u, v, width=1, headwidth=4, units='dots')
    return lines, arrows

def tangent_lineation_plot(ax, strikes, dips, rakes):
    """Makes a tangent lineation plot for normal faults with the given strikes,
    dips, and rakes."""
    # Calculate the position of the rake of the lineations, but don't plot yet
    rake_x, rake_y = mplstereonet.rake(strikes, dips, rakes)

    # Calculate the direction the arrows should point
    # These are all normal faults, so the arrows point away from the center
    # Because we're plotting at the pole location, however, we need to flip this
    # from what we plotted with the "ball of string" plot.
    mag = np.hypot(rake_x, rake_y)
    u, v = -rake_x / mag, -rake_y / mag

    # Calculate the position of the poles
    pole_x, pole_y = mplstereonet.pole(strikes, dips)

    # Plot the arrows centered on the pole locations...
    arrows = ax.quiver(pole_x, pole_y, u, v, width=1, headwidth=4, units='dots',
                       pivot='middle')
    return arrows

if __name__ == '__main__':
    main()
Result