stereonet_explanation.py
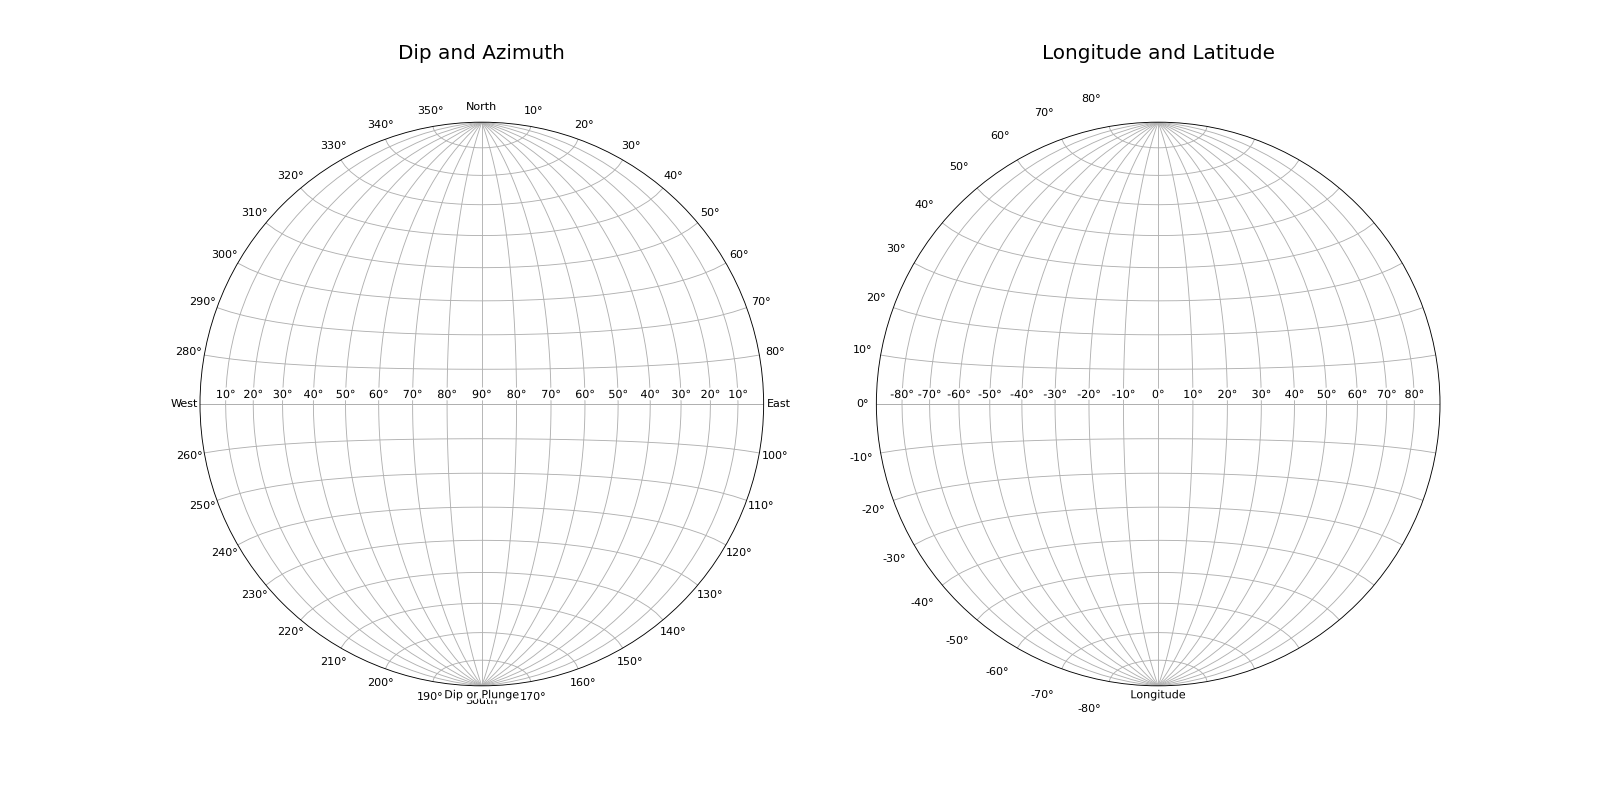
This figure illustrates the difference between the “internal” coordinate system of longitude and latitude that plotting actually takes place in (e.g. if you were to use ax.plot or any other “raw” matplotlib command) and the conceptual coordinate system that a lower-hemisphere stereonet represents.
import matplotlib.pyplot as plt
import numpy as np
import mplstereonet

def main():
    fig, (ax1, ax2) = setup_figure()
    stereonet_projection_explanation(ax1)
    native_projection_explanation(ax2)
    plt.show()

def setup_figure():
    """Setup the figure and axes"""
    fig, axes = mplstereonet.subplots(ncols=2, figsize=(20,10))
    for ax in axes:
        # Make the grid lines solid.
        ax.grid(ls='-')
        # Make the longitude grids continue all the way to the poles
        ax.set_longitude_grid_ends(90)
    return fig, axes

def stereonet_projection_explanation(ax):
    """Example to explain azimuth and dip on a lower-hemisphere stereonet."""
    ax.set_title('Dip and Azimuth', y=1.1, size=18)

    # Set the azimuth ticks to be just "N", "E", etc.
    ax.set_azimuth_ticks(range(0, 360, 10))

    # Hackishly set some of the azimuth labels to North, East, etc...
    fmt = ax.yaxis.get_major_formatter()
    labels = [fmt(item) for item in ax.get_azimuth_ticks()]
    labels[0] = 'North'
    labels[9] = 'East'
    labels[18] = 'South'
    labels[27] = 'West'
    ax.set_azimuth_ticklabels(labels)

    # Unhide the xticklabels and use them for dip labels
    ax.xaxis.set_tick_params(label1On=True)
    labels = list(range(10, 100, 10)) + list(range(80, 0, -10))
    ax.set_xticks(np.radians(np.arange(-80, 90, 10)))
    ax.set_xticklabels([fmt(np.radians(item)) for item in labels])

    ax.set_xlabel('Dip or Plunge')

    xlabel_halo(ax)
    return ax

def native_projection_explanation(ax):
    """Example showing how the "native" longitude and latitude relate to the
    stereonet projection."""
    ax.set_title('Longitude and Latitude', size=18, y=1.1)

    # Hide the azimuth labels
    ax.set_azimuth_ticklabels([])

    # Make the axis tick labels visible:
    ax.set_xticks(np.radians(np.arange(-80, 90, 10)))
    ax.tick_params(label1On=True)

    ax.set_xlabel('Longitude')

    xlabel_halo(ax)
    return ax

def xlabel_halo(ax):
    """Add a white "halo" around the xlabels."""
    import matplotlib.patheffects as effects
    for tick in ax.get_xticklabels() + [ax.xaxis.label]:
        tick.set_path_effects([effects.withStroke(linewidth=4, foreground='w')])

if __name__ == '__main__':
    main()
Result