two_point.py
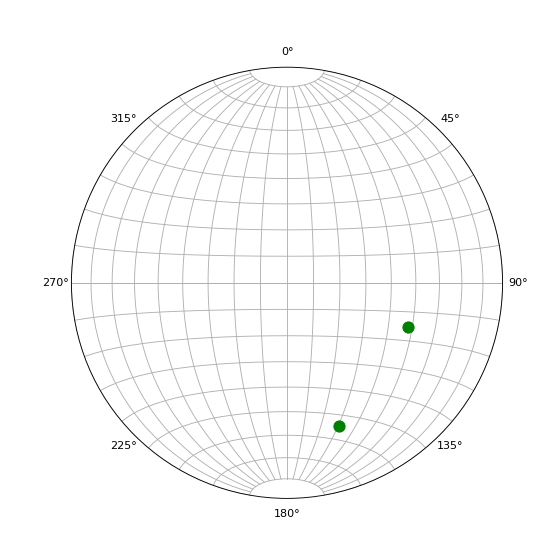
Demonstrates plotting multiple linear features with a single ax.pole call.
The real purpose of this example is to serve as an implicit regression test for some oddities in the way axes grid lines are handled in matplotlib and mplstereonet. A 2-vertex line can sometimes be confused for an axes grid line, and they need different handling on a stereonet.
import matplotlib.pyplot as plt
import mplstereonet

fig, ax = mplstereonet.subplots(figsize=(7,7))
strike = [200, 250]
dip = [50, 60]
ax.pole(strike, dip, 'go', markersize=10)
ax.grid()
plt.show()
Result