fit_girdle_example.py
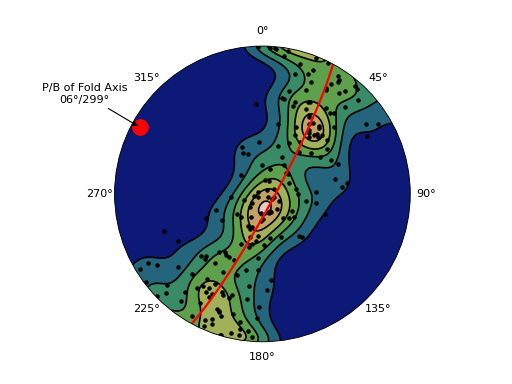
Illustrates fitting a plane to a “gridle” distribution using fit_girdle.
This example simulates finding the plunge and bearing of a cylindrical fold axis from strike/dip measurements of bedding in the fold limbs.
import numpy as np
import matplotlib.pyplot as plt
import mplstereonet
np.random.seed(1)

# Generate a random girdle distribution from the plunge/bearing of a fold hinge
# In the end, we'll have strikes and dips as measured from bedding in the fold.
# *strike* and *dip* below would normally be your input.
num_points = 200
real_bearing, real_plunge = 300, 5
s, d = mplstereonet.plunge_bearing2pole(real_plunge, real_bearing)
lon, lat = mplstereonet.plane(s, d, segments=num_points)
lon += np.random.normal(0, np.radians(15), lon.shape)
lat += np.random.normal(0, np.radians(15), lat.shape)
strike, dip = mplstereonet.geographic2pole(lon, lat)

# Plot the raw data and contour it:
fig, ax = mplstereonet.subplots()
ax.density_contourf(strike, dip, cmap='gist_earth')
ax.density_contour(strike, dip, colors='black')
ax.pole(strike, dip, marker='.', color='black')

# Fit a plane to the girdle of the distribution and display it.
fit_strike, fit_dip = mplstereonet.fit_girdle(strike, dip)
ax.plane(fit_strike, fit_dip, color='red', lw=2)
ax.pole(fit_strike, fit_dip, marker='o', color='red', markersize=14)

# Add some annotation of the result
lon, lat = mplstereonet.pole(fit_strike, fit_dip)
(plunge,), (bearing,) = mplstereonet.pole2plunge_bearing(fit_strike, fit_dip)
template = u'P/B of Fold Axis\n{:02.0f}\u00b0/{:03.0f}\u00b0'
ax.annotate(template.format(plunge, bearing), ha='center', va='bottom',
            xy=(lon, lat), xytext=(-50, 20), textcoords='offset points',
            arrowprops=dict(arrowstyle='-|>', facecolor='black'))

plt.show()
Result